Asset dashboard
see map of Service
see map of Case
When you select an asset from the
Axeda® Service
or Case
application pages, you see all information, tasks, associations,
and functionality assigned to that asset; this information
appears in a series of modules
in three columns (left, center, and right, as you face your monitor).
The set of modules and their content are specific to the model, the asset,
and your preferences. For each
model, you can configure by model
the layout of the Asset dashboard from the Configuration application (see
Specify
Default Asset Dashboard Layout).
You can also configure some modules to refresh automatically and/or to
be hidden when empty (see Module Preferences).
Note:
When describing the location of modules on the Asset dashboard, this help
system assumes that you are using the default layout.
The navigation
path shows the asset you are viewing and enables you to navigate through
the Service or Case
applications. The icons
shown in the various modules help you quickly discern the type of item
shown and, in some cases, the current status
of
that item.
Each time you make a change to the asset or its information, this page
refreshes automatically to show the results of those changes. To refresh
the page manually, click the name of the asset in the navigation path.
In addition, the page also updates its data based on
the Platform configuration.
(See the Administration application for the configuration settings for
the Axeda Platform.)
When you use the default layout for the Asset dashboard,
the middle
of this page shows
the following information for the asset:
o Serial Number and Model Name of the asset and an image of the asset - If
an asset is missing,
for the asset appear
gray. If an image of the asset
is not shown, you can add a model image
to the Platform for display in this page.
o Asset Group
- the fully qualified path name of each asset group to which this asset
has been assigned, whether by default, manually, or through a dynamic
group definition. For example, if the asset group is the default model
asset group created when the asset registered with the Platform, Model
XY Default Group, this field shows the following path name for the asset
group
/Root Asset Group/Default Model Group/Model XY Default
Group
For more information about asset groups, refer to: Root
Asset Group definition, Default
Model Group definition, and Parent
Asset Group definition.
o Status - the asset condition with the highest severity. If no
other asset condition has been set, this shows the default asset
condition, Good. This default
condition has the lowest severity, 1, and is represented by a green circle.
If this asset has additional conditions (for example, another events has
triggered a different asset condition), you can see all
conditions currently set for the asset, in order of priority by clicking
the asset condition icon.
o Registration - the date and time that the asset
running an Axeda agent first registered with the Platform.
If the asset is still unregistered, it will be defined as "Not Registered".
For assets monitored
by tracking devices, the date and time that the tracking device first
registered with the Platform.
o Last contact - the date and time that the
agent running on an asset
or the tracking device for an asset last communicated with
the Platform. The date and time are local to the Platform, not the asset.
Note that this value is not updated
for muted assets.
o Backup Agent - only if the asset has a configured
Backup Agent and you have privileges to see Backup Agents, this line displays
the date and time that the Backup Agent last contacted the Platform. For
additional information about configuring Backup Agents, refer to the user's
guide for your Axeda Gateway or Axeda Connector Agent.
o Agent Version - the version number of the agent
running on the asset; for example, 6.1 for Axeda® Gateway, or "M2M"
to indicate a "smart", mobile or fixed, wireless asset.
o Ping rate
- the number of seconds that an agent waits between communications to
the Axeda Platform. If the ping rate is 0, then either the asset has not
registered yet with the Platform OR the asset is a wireless asset that
is configured for the Shoulder Tap delivery method and is also configured
NOT to poll the Platform (the poll rate is set to NULL). Such assets receive
updates from the Platform only by responding to the Shoulder Tap messages
sent to them by the Platform. For more information about Shoulder Tap
messaging for wireless assets, refer to Shoulder
Tap Messaging for AWP Assets.
Note: For assets running
Axeda Gateway or Axeda Connector AND running a Backup Agent, keep in mind
that this field always shows the ping rate of the Primary Agent. It never
shows the ping rate of the Backup Agent. See Backup
Agent for more information.
o - time zone where
the asset is located.
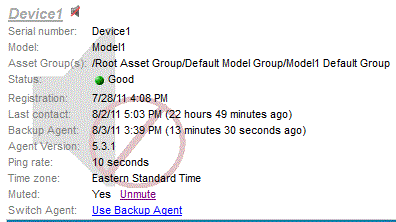
o Muted - if the asset
is muted, this will show Yes;
if not muted, this will show No.
To change, select the link to Mute or Unmute. (If this link is disabled,
then this asset is managed by a managing gateway, in which case you need
to mute or unmute that managing gateway.)
Is this asset defined as part of a redundant gateway configuration? If
so, this managed asset will not appear as muted unless all defined redundant
gateways are muted. See Redundant
Gateways definition for complete information.
When you select to Mute or Unmute, you are prompted to confirm that you
really want to mute or unmute the asset. Also, when an asset is muted
the dashboard shows a muted watermark and muted icon beside the serial
number heading:
Appearance
if muted (for example)

o Switch Agent
- only if the asset has a configured Backup Agent and you have privileges
to see Backup Agents, the link in this field allows you to switch to the
Backup Agent. Once the Backup Agent is running, the link allows you to
switch back to the Primary Agent. When you switch to the Backup Agent,
the serial number heading is displayed in red typeface and the words,
"(Backup Agent)", are appended to the serial numbering heading.
These changes are visible to any user, not just users who have privileges
to see Backup Agents. See Backup
Agent for more information.
o Gateway - If this asset is managed by an Axeda
Gateway agent, then the name (and a link to the Asset dashboard) for the
asset operating as the gateway for this asset is shown.
Note: This page is refreshed
every 60 seconds. To force it to refresh, select the Asset name link heading.
Additional information for the asset ("modules")
Note: The Asset
dashboard may display one or more Extended
UI Modules, if they have been defined for the model (and if you have
privileges to view Extended UI Modules).
Also note that on the Asset dashboard of target assets ( assets that are
associated with other assets as a
target/destination asset), forwarded data is included in various modules.
Only data that is produced by an Agent is forwarded to target assets and
displayed on the asset dashboard. Any data that is generated by an expression rule is NOT
forwarded to target assets.
o Asset Associations
o Location
o Managed
assets
o Contacts
o Notes
o Displays and
Charts
o Rules
o Properties
o Maintenance Items
Actions (status)
o Recent Actions - shows the status of all update
actions, both pending and executed for this asset. To see all recent actions
for the asset, click View all.
Information from the asset
o Alarms
o Data
o Uploaded Files
IMPORTANT: If
the asset is muted,
you will be able to view uploaded files but you will not be able
to select the View All link to view all uploaded and uploading files or
perform actions on the file uploads. Once that asset is unmuted, all file
upload functionality is restored. While an asset is muted, no files will
be transferred between the Platform and that asset.
o Audit Log
o Events
o Case
o Asset Connectivity
Actions you can perform
IMPORTANT: If
the asset is muted, you will be able to view
information in the following modules but you will not be able to perform
the related operations (including running actions or scripts, pausing,
resuming or canceling file uploads, starting remote sessions, and so forth).
The only tasks available from the Tasks module while an asset is muted
include: Edit this Asset, Add this asset to watch list, and E-mail asset.
Once the asset is unmuted, full functionality is restored.
o Tasks
o Actions
o Scripts
o Remote Sessions
o Deployed Packages
Jump to - If you don't see the
information you need for the asset in this page, use the Jump to list to display more
information. If the asset is
muted,
you will be restricted to viewing only those pages that do not contain
functionality that will result in communications to the muted asset. If
the asset is unmuted, all pages to which you have privileges are available. For
example, click Available scripts
to see a list of all scripts registered for this asset as well as the
names of the script authors and descriptions of each script. The
options in this list vary. The page shown for a Jump to selection contains
the same information as that shown for a View
all link when selected from one of the dashboard modules;
for the Available scripts example above, that would be the View all link
from the Scripts module.
